Prior modeling and uncertainty quantification in X-ray computed tomography with application to defect detection in subsea pipes
Summary
Non-desctructive inspection of subsea pipes can be carried out using X-ray CT. The goal of such inspections is to verify the structural integrity of the pipes to avoid environmentally damaging and costly leaks. In this work, Christensen et al. (2023), we focus on defect detection in the pipes. With traditional CT reconstruction techniques a cross-sectional image of the pipe can be obtained given complete and high-quality data. Carrying out defect detection based on such images requires manual inspection or post-processing using for example segmentation techniques. We propose a Bayesian decomposed reconstruction framework that automatically separates the large scale structure of the pipes (circular layers of different materials) from the small defects that we are interested in detecting. In other words, defect segmentation is integrated in the reconstruction method and carried out simultaneously. Another advantage of our framework is that the Bayesian approach enables uncertainty quantification related to the reconstruction.
Our method heavily depends on prior information about the two types of structure in the subsea pipes to separate them. For the large scale layered structure we encode the prior with information about the pipes that is generally known when the pipe manufacturing details are available: the number of layers of different materials, the attenuation properties of each layer, as well as the thickness of each layer. The prior representing the defects is formulated such that it promotes an image with few and small features.
Our decomposed reconstruction framework is implemented using CUQIpy. We use a wide range of CUQIpy’s features, for example: Gaussian, Gamma, and inverse Gamma distributions from the distribution module cuqi.distribution, parameter mappings using cuqi.geometry.Image2D, a user-defined forward model based on cuqi.model.Model, and hierarchical modelling and Gibbs sampling using cuqi.sampler.HybridGibbs. Especially, the user-defined forward model demonstrates the versatility of CUQIpy. Our forward model can be defined:
where is the noisy CT data, is the CT forward operator (here implemented using the third-party library ASTRA van Aarle et al. (2015), van Aarle et al. (2016)), and and are two unknown parameters representing images of the pipe’s large scale layered structure and the defects respectively. This is a challenging forward model to accommodate for general purpose software because it 1) depends on multiple parameters, and 2) depends on third-party software. However, CUQIpy’s user-defined functionality enables the implementation of this particular forward model so it can be integrated with CUQIpy’s other modules such as distributions and samplers. A link to the full implementation can be found in the resources section below.
We demonstrate our proposed methodology using real data from a 2-dimensional CT scan of a subsea pipe. The figures below show that we can succesfully reconstruct the large scale layered pipe structure and the defects seperately including uncertainty estimates for each reconstruction. Our results demonstrate how prior modelling can aid defect detection in X-ray CT inspection of subsea pipes. Our framework provides a separate image of defects in the subsea pipe readily available for further analysis. Furthermore, the Bayesian approach provides uncertainty estimates related to the reconstruction of the defect image, which might aid the analysis and risk evaluation associated with the detected defects.
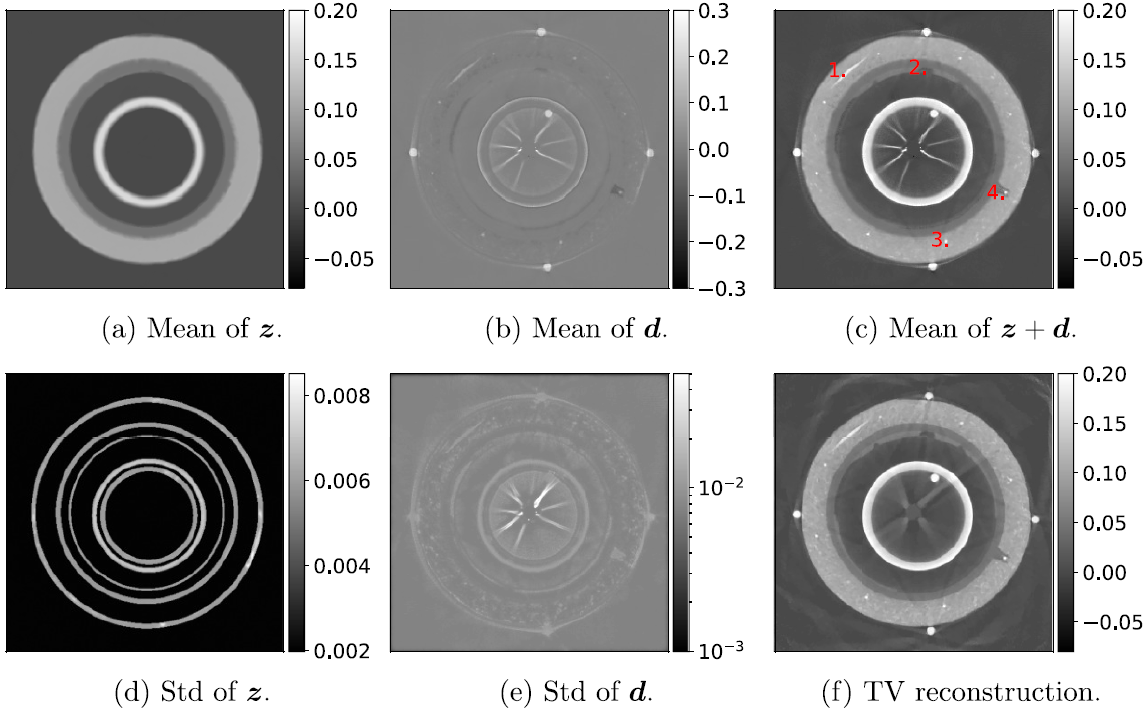
Figure 1. (a)–(e) Posterior mean and standard deviations using real data. (f) TV reconstruction of the same data for comparison. Images of sizes 500×500 pixels.
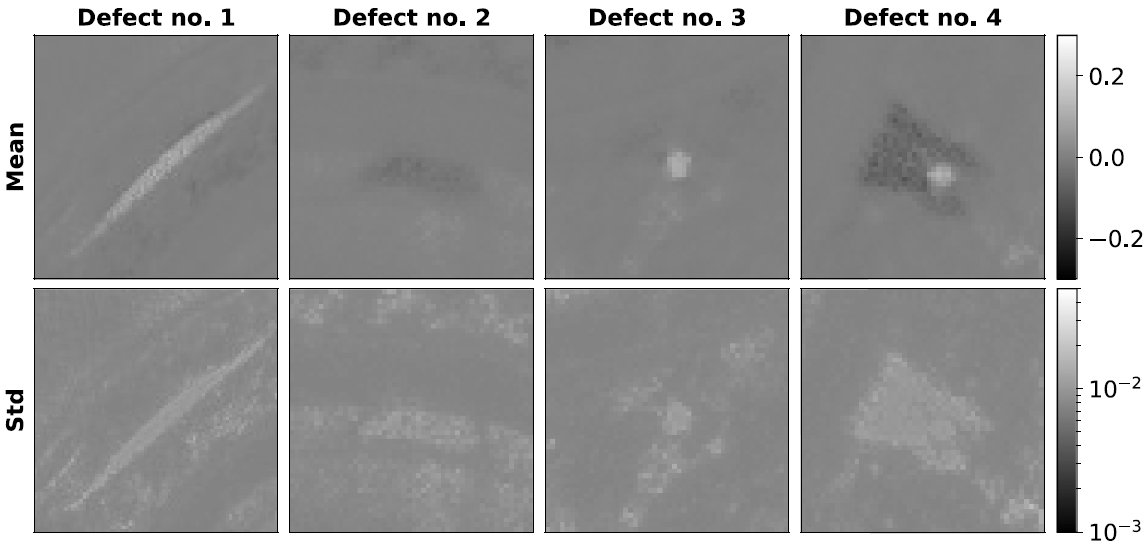
Figure 2. Zoom-in view of the posterior mean and standard deviation of the defect reconstruction. Defect numbers are defined in figure 1(c). Defect 1 images are 80×80 pixels, and defect 2, 3, and 4 images are 50×50 pixels.
Resources
Paper: Christensen et al. (2023)
Paper code GitHub repository: https://
github .com /CUQI -DTU /Paper -PipeDefectSplitting
- Christensen, S. L., Riis, N. A. B., Pereyra, M., & Jørgensen, J. S. (2023). A Bayesian approach for CT reconstruction with defect detection for subsea pipelines. Inverse Problems, 40(2), 025003. 10.1088/1361-6420/ad1348
- van Aarle, W., Palenstijn, W. J., De Beenhouwer, J., Altantzis, T., Bals, S., Batenburg, K. J., & Sijbers, J. (2015). The ASTRA Toolbox: A platform for advanced algorithm development in electron tomography. Ultramicroscopy, 157, 35–47. https://doi.org/10.1016/j.ultramic.2015.05.002
- van Aarle, W., Palenstijn, W. J., Cant, J., Janssens, E., Bleichrodt, F., Dabravolski, A., De Beenhouwer, J., Batenburg, K. J., & Sijbers, J. (2016). Fast and flexible X-ray tomography using the ASTRA toolbox. Opt. Express, 24(22), 25129–25147. 10.1364/OE.24.025129