6. Cochlear aqueduct advection and diffusion inferred from computed tomography imaging with a Bayesian approach
6.1. Summary
Fluid flow and transport of therapeutic agents and pathogenic bacteria into the cochlea has been challenging to study due to its small size and location within bone. In this work, Alghamdi et al. (2025), we take advantage of recent non-invasive Computed Tomography (CT) imaging of tracer transport to infer transport parameters in a 1-dimensional advection-diffusion model of the cochlear aqueduct using a Bayesian approach.
We develop a hierarchical Bayesian inversion framework in which we combine the CT tracer data and the 1-dimensional model to infer the model advection and spatially-varying diffusion parameters. The noise level of the CT data is inferred as part of the inversion using a hyperparameter. We characterize the posterior distribution of these parameters using NUTS within Gibbs sampling. We verify our inference by comparing the model-predicted tracer concentration to the CT data and by comparing the inferred parameters to literature values. We validate our framework using synthetic data generated from the advection-diffusion model with known parameters.
We use CUQIpy to implement the Bayesian inversion framework. We use cuqi.pde.TimeDependentLinearPDE to implement the advection-diffusion forward model and extract the observed tracer concentration at the locations and times of the CT data. Using CUQIpy Bayesian modeling capabilities, we model the posterior, which includes a likelihood distribution and priors for the advection and diffusion parameters and noise level. We use the cuqi.sampler.HybridGibbs to sample the posterior distribution which enables us to specify sampler choice for different parameters. We specify cuqi.sampler.NUTS as the sampler for the advection and diffusion parameters and use direct sampling for the noise level. The link to the code is provided in the resources section below.
Our results demonstrate that the evolution of the concentration of tracer in the cochlear aqueduct is well predicted by the advection-diffusion model using inferred parameters. Though diffusion of the small CT tracer varies along the aqueduct, it is usually near the free diffusion and therefore not likely to be influenced much by membranes or flow. Advection is inferred near zero in most cases. The figure below shows the inferred diffusion profile (first column), noise level (second column), and advection parameter (third column) for two cases, animal 3 left ear and animal 4 right ear. In our work, we show analytically how to use these results to estimate transport through cochlear aqueduct for other animals and molecules.
We conclude that free diffusion dominates transport of small molecules in the cochlear aqueduct, which can therefore be effectively approximated using simple 1-dimensional (advection-)diffusion formulas.
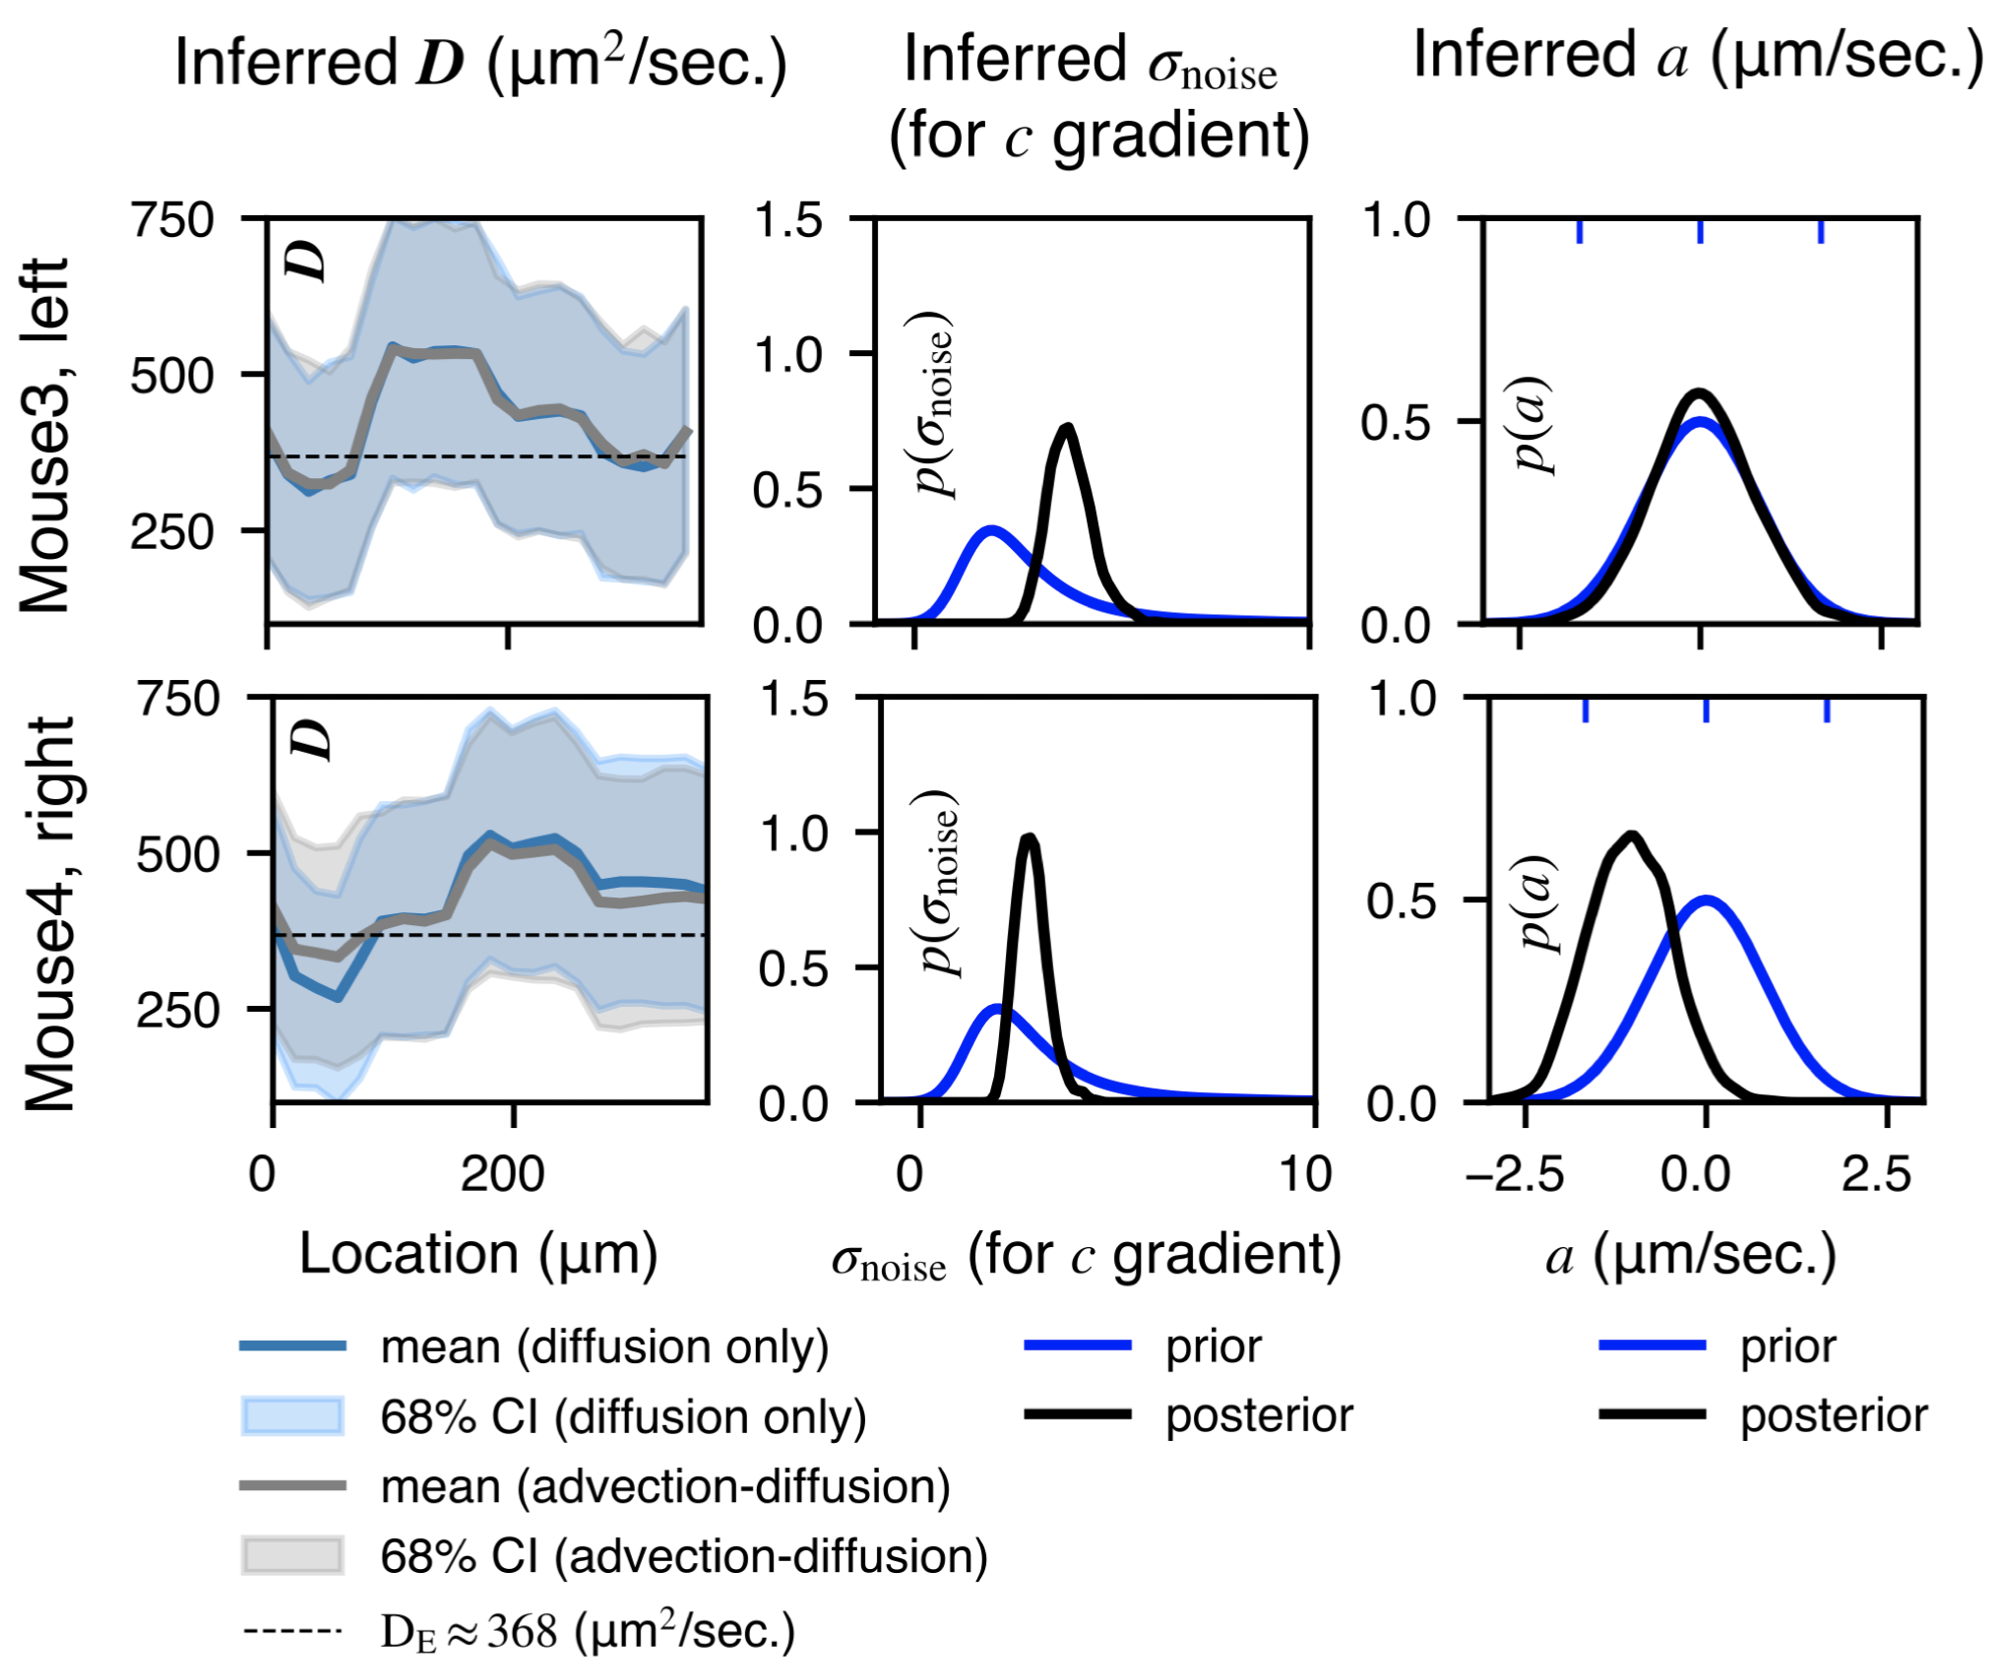
Inferred spatially-varying diffusion (first column), noise level (second column), and advection speed (third column) in two animals, mouse 3 left ear and mouse 4 right ear. Note that in the first column, we show two inference results, one with assuming that the transport model is only governed by diffusion (blue) and the other one assuming that both advection and diffusion are present (gray). The inferred diffusion profiles are similar in both cases, and the inferred advection is very small, suggesting that diffusion dominates transport in the cochlear aqueduct. DE is the free diffusion coefficient of the tracer estimated from the literature.
6.2. Resources
Paper: Alghamdi et al. (2025)
Paper code GitHub repository: https://
github .com /CUQI -DTU /Paper -Cochlear
- Alghamdi, A., Mathiesen, B. K., Miyakoshi, L., Nedergaard, M., Jørgensen, J. S., & Bork, P. A. R. (2025). Cochlear aqueduct advection and diffusion inferred from computed tomography imaging with a Bayesian approach.